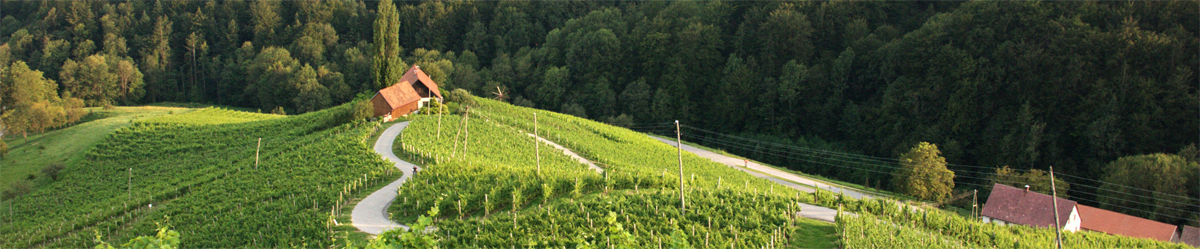
1) First of all the farmer has to define the basic situation of the farm
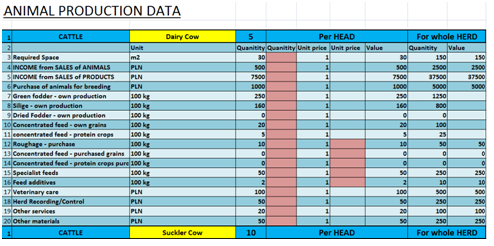
In the first sheet, the user is supposed to complete the tables with real values from the farm. In the orange table for plant production, selects plants from the list, specify the area, and then selects the crop type from the list. In the table with animals the user has to choose from the list of species and give the number of animals in the appropriate place.
Picture 1. Basic situation of the farm in BP tool
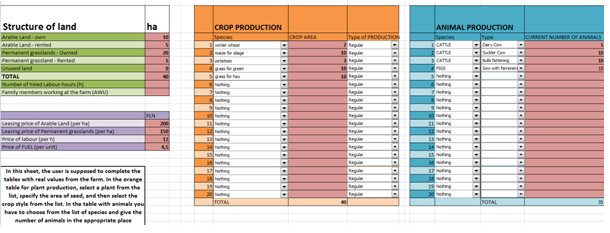
2) The second step is counting the depreciation of the farm
Indirect costs – the costs which can’t be clearly assigned to the particular production activities. They divide for: general production costs and general enterprise costs (for instance accountancy, fixed assets deprecation, transport, costs of management board).
A typical example of a fixed/indirect cost of the farm is the depreciation of fixed assets – for example, machines, equipment, buildings, and in fruit production also plantations of trees or fruits.
When purchasing a fixed asset (similarly building a building), as part of the investment process, we incur one-off expenses, often in significant amounts. Entering this type of expenses at once into the production costs of the year in which these expenses took place is not justified because one of the basic features of fixed assets is that they are used for many years. Therefore, the value of the investment, or expenses for the purchase of fixed assets, is spread over the anticipated or contractual period of their use. This part of the value of the fixed asset, which falls into each year of its operation is referred to as “depreciation” – entered into the cost of production becomes “depreciation cost”:
Depreciation = Purchase value of a fixed asset: Number of years of service
or
Depreciation = Purchase value of a fixed asset * Depreciation rate (depreciation rate = 1 / number of years of operation).
Each of the 3 tables in BP tool works in the same way. After the year of production, replacement value and depreciation time, the remaining values will automatically be added. For the buildings used for animals it can be added a surface (it will be used in the further calculation).
Picture 2. Calculation of the depreciation in BP tool
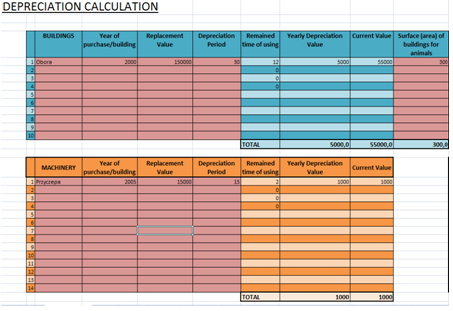
3) Third step: CROP and ANIMAL PRODUCTION DATA for Gross Margin
A special type of calculation on a farm is a Gross Margin which we calculate for individual production activities (wheat, apples, potatoes, milk, pig livestock, etc.) according to the general formula:
Gross margin = Production value minus direct costs.
This formula applies to commodity activities whose products may be intended for sale and there is a market price for them. In the case of activities whose products are not widely traded (eg, roughage, such as hay, silage produced and used on the farm) and generally there is no market price for them, instead of gross margin we simply calculate direct production costs.
Direct costs – the costs which can be clearly assigned to the particular production activities. They include (in agriculture) for instance: seeds costs; fertilizers; plant protection; labour and machinery used for particular production; special materials and machinery, animal feed, veterinary services, medicines, insemination.
The third sheet CROP PRODUCTION and the fourth sheet ANIMAL PRODUCTION allows to calculate the Gross Margins for each of the plants which are grown at the farm and animal species which are kept. In order to do that the used can base on the given averages or insert his/her own production costs into the tables.
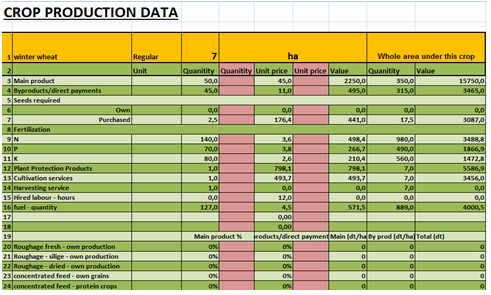
Picture 3. Calculation of Gross Margins for Crop and animal production in BP tool
4) The fourth step: CALCULATING FARM PROFIT
The most general formula for calculating farm profit is:
Farm profit = Revenues (incomes) minus Costs,
which we can also save as:
Farm profit = Revenues (incomes) minus Direct costs minus indirect costs
Because we subtract direct costs from revenues, when calculating the Gross Margin, therefore in our case the farm profit is calculated in the following way:
Farm profit = Gross Margin minus Indirect costs
Gross Margin in this formula is in fact the sum of incomes from various activities (crops and animals). If you increase the value of the Gross Margin from a single crop, or replace crop with low Gross Margin, another activity that generates a larger Gross Margin, it is enough to state that the agricultural income from the farm will improve. We do not have to allocate indirect costs between activities for this purpose, because they are relatively constant, regardless of the changes we make in the structure or intensity of production.
By adding off farm incomes and off farm costs we calculate the Personal Profit of the Farm
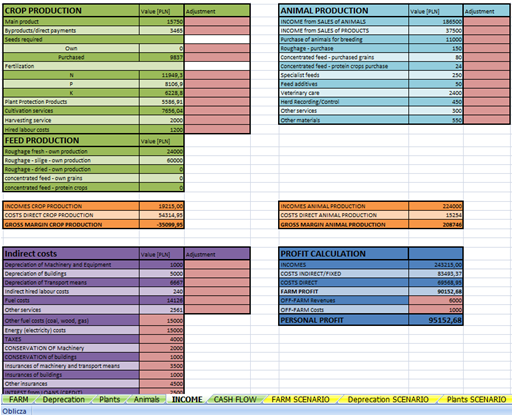
Picture 4. Calculation of Farm Profit in BP tool
5) The fifth step: Calculation of cash flows
Every activity, this also applies to private life, is related to the cash movement. We spend money, we receive money as payment for the work done or products sold. So one can say that the money “flows” through the farm. That is why the name: cash flow statement, which consists in the fact that we compile (balance) all deposits and withdrawals, both in cash and using bank accounts.
It is obvious that you cannot spend more money than at the moment. The balance of cash flows (the difference between inflows and withdrawals) may be zero in the worst case. However, in the planning process, the analysis of cash flows is of fundamental importance. It answers the question: can the money obtained from the activity cover the planned expenses related to running the farm? If not, you may need to take out a loan or change your spending plans.
At the farm we balance all proceeds and expenses of money from four activities:
Operating activity – includes inflows and outflows from the basic activity of a farm, i.e. plant and animal production and service activities (eg services provided by farm equipment).
Investment activity of the holding includes inflows and expenses related to the purchase / construction and sale of fixed assets, eg concerning the sale / purchase of a tractor, construction of a barn or subsidies for investment.
Financial activity of the holding covers all loans and loans taken for the purpose of the farm and the repayment of such loans with interest.
Private money flows – includes all payments and withdrawals related to the personal life of the farmer and his family. Payments and withdrawals as part of this activity may refer to earning out-of-farm income, pension and retirement benefits, separate non-agricultural activities, family maintenance, home maintenance, etc.
For simplicity reasons we added the Private money balance into the final cash balance.
Cash balance at the farm at the end of a given period (eg year) is calculated as follows:
BALANCE OF TOTAL CASH IN THE FARM = Cash held at the beginning of the period + operating balance + investment activity balance + balance on financial activity + private balance.
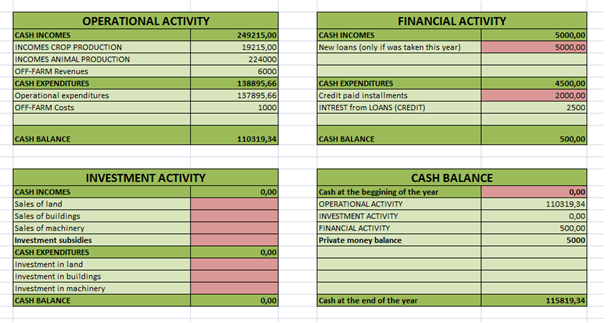
Picture 5. Calculation cash flows in BP tool
Interpretation of the Farm Profit vs. Cash Flows
It happens that in a given year farm profit is assessed as high, and the farmer lacks money “on hand” because the cash flows are negative. Such a situation may occur if the farmer has made significant investment expenditures, repays the loan, if he needs more money for household expenses. This does not mean in the situation described that production is not “profitable”. The next year, the balance of cash flows may be significantly improved – if there is no more investment expenditure, if the farmer sells inventories of products collected from the production of the previous year, etc.
For the same reasons, paradoxically, the reverse situation may occur. Agricultural income in a given year is relatively low (eg due to worse harvest), but after paying off all liabilities in the previous year, sales of stored products and use of stocks of production resources (we do not incur expenses, because the purchase was made in the previous year) flows cash shows a high positive balance.Therefore, agricultural income (farm profit) should be treated as an economic measure of economic efficiency, and cash flow is an element of financial management on the farm.
6) The last step: SCENARIO ANALYSIS
In this part the used is asked to create a scenario for a farm according to the strategy chosen for the future. In the tables, on the left side, there is an additional column, which present the values entered on the basic farm situation. In the right column user can enter new values for the scenario planned in the strategy. Below the tables there are “buttons” that allow the user to manipulate various values, change costs of production, prices of products, yields. All the other tables are similar to the previous sheets, with one difference – they contain the basic and scenario situation.
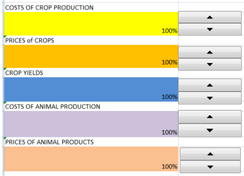
Picture 6. buttons that allow the user to manipulate various values
The scenario analysis allows also to simulate the possible changes depending on the strategy choice of the farmer. It gives information about the future farm gross margins, net profit, cash flows and cash balance, after realization of a certain strategy. It balances also the feeds for animals. It gives the possibility of quick change of parameters (allows to test different variants of the strategy and to check sensitivity of results of changes of some key parameters – like prices, variable costs, fixed costs, financing sources, subsidies etc).
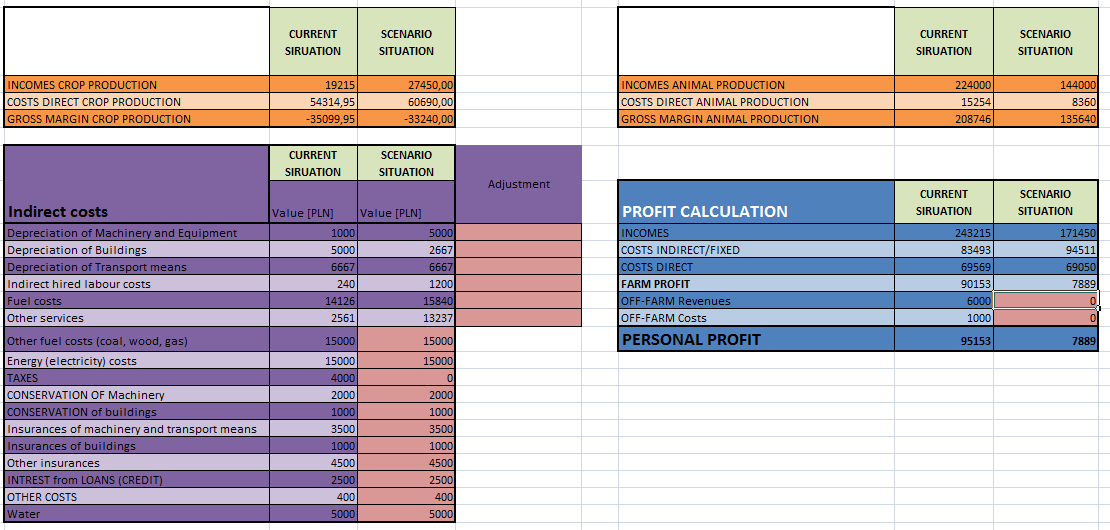
Picture 6. Farm scenario analysis (basic and scenario situation compared in BP tool)
……Concluding
The BP Tool could be used in agricultural trainings, in daily work of farm advisors and individually by more skillful farmers. It also could be used as a part of the curriculum for agricultural economics students. The business planning training was incorporated into the ISM+ trainings, during the 3rd training day (short version – 3 h) or as a separate training taking 4-6 training hours.
Business-planning module was very much appreciated by farmers, as something, which was currently missing in their experiences with trainings and with the ISM method from the past projects. Farmers were very active in discussing economic issues, often being inspired by others.